|
***During the COVID-19 outbreak, it is important to remember not to panic, but to be precautious and stay safe. Please be sure to wash your hands thoroughly and properly, and practice social distancing at this time.*** Stay safe we can fight this ❤️ I've actually never even been amazed at exponential growth and its graph until I watched this YouTube video of how it is related to epidemics: www.youtube.com/watch?v=Kas0tIxDvrg&t=8s. I highly encourage you watch it, to learn about the applications of exponential growth. Exponential growth is all about increasing/decreasing growth with respect to the previous value in time. For instance, if the population (of any kind) keeps increasing by a factor of 2 every week, then the current value is 2*previous value. So if the population starts at 2, it go up to 4, 8, 16, 32, ....for every week and so on. 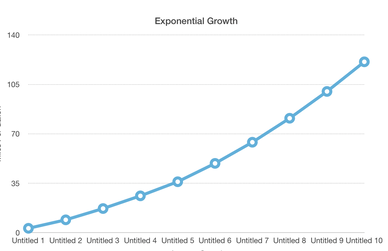
Obviously, there needs to be a tipping point or a stabilizing point where the growth is 'stabilized' and is set to a maximum value reach. This is where the population stays constant at a certain value (tho in real life there may be some fluctuations). This means that in real life, things can't really 'grow exponentially' forever. There has to be a point where it stabilizes due to external changes. Since things can grow exponentially only for some time (and not forever), here is a more realistic formula, or expression: f(t) = a(1+r)^tHere, the t represents the time (in months, years, weeks or days), r represents the growth rate, and a represents the initial number we started with. The 1+r represents the total constant that is being multiplied by the previous value in time, as I mentioned earlier. So in this case, it is (next_value) = (1+r)*(prev_value) 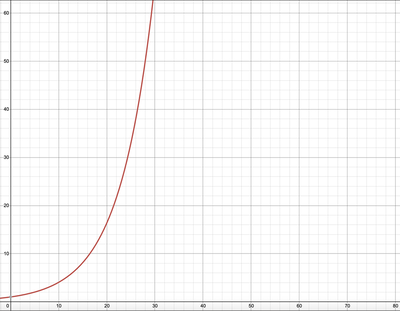 Image of an exponential increasing by a rate of 0.15. However, exponential growth doesn't stay forever, so when it balances out and stabilizes to a constant value, it resembles a logistic growth curve. It means it has a carrying capacity. Since exponentials trail on to infinite values, we can't rely on this to predict population growths..etc. 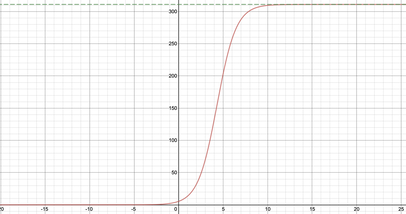 Image of an exponential increasing by a rate of 0.15. This collab notebook from Amita Kapoor plots the number of cases in different countries, compared to an exponential curve graph: colab.research.google.com/drive/1jJAa7QFOCMRrQu4ZAJg6Rc4wNEWF-jFn Stay safe during these times, and don't panic. There will be a stabilizing point, but in order to stabilize it soon, we need to make sure to practice social distancing.
0 Comments
|
Archives
May 2021
Topics
All
|
 RSS Feed
