|
***During the COVID-19 pandemic, it is important to remember not to panic, but to be precautious and stay safe. Please be sure to wash your hands thoroughly and properly, and practice social distancing at this time.*** Stay safe we can fight this ❤️ Whenever I think of a linear classifier or linear machine learning model the first thing that comes to my mind is the equation y = mx + b. This equation does wonders in sooooo many different fields and applications. It is essentially the foundation of how some ML models make predictions for testing data points. What's 'classification'?Classification is when we use some form of data's characteristics to determine which group the piece of data falls into. For example detecting whether a movie review is "good" or "bad", or grouping email as "spam" or "not spam". These situations all fall into "statistical classification", where the underlying problem is to identify which group a new piece of data belongs to, by using training data to learn the pattern. 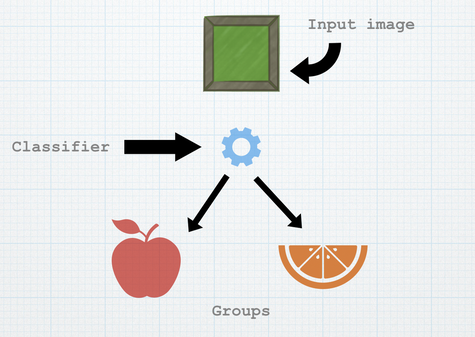 Linear ClassifiersLinear classifiers use classification on a linear function of inputs. A binary linear classifier uses classification on a linear function and identifies which of the two groups a new observation belongs to. Note: that binary classifiers only deal with two targets or 'groups'. So how would we collect the input data or 'image', (as shown in the previous example above)? When dealing with classification, our data consists of input dimensions or features. It also consists of target variables, which represents the 'end result'. In binary classification, the 'target' variable (or the end result) can be 1 of 2 values (0 or 1, true or false..etc - a binary valued target). An example can be to implement a medical diagnosis system, where you predict whether a certain patient might carry an infection. The input data consists of the patient's history, and symptoms, which are the features, and the target is whether they are carrying the infection or not. A classifier acts as a decision boundary, where one side corresponds to one input, and the other side corresponds to the other input. Inputs and Weights and BiasesA binary target value has two different possibilities, or "classes", which represents the end result (for ex: whether the email was spam, or not spam). In a machine learning model, the training dataset consists of the feature variables and the corresponding target values for those variables. This is for the data we already know about, or have with us. We are going to use this data to predict the target variable for other 'not seen' cases. Hope this makes sense because it does get kind of tricky! So how are the predictions for the unseen data computed from this training data? The model basically computes a linear function (like Y = MX + B) based on something called weights and biases. The model then checks whether the output of the function is greater than or less than a constant threshold, lets call it r. So this is essentially the raw model output: raw model output = coefficients • features + interceptSo the raw model output is basically the dot product of the 'coefficients' (which are the weights) and the feature variables, and an intercept (which is the bias). The weights essentially represent the importance of a particular feature variable in a model. For instance a particular symptom for an infection might be a very critical factor as to whether the patient is infected or not, so it has a greater weight associated with it. So in binary linear classification, if the model output is less than the threshold, it is equivalent to one class; if it is greater than the threshold the data point belongs to the other class. In this example, the threshold value is 0. Therefore, if the model output is a positive value, it is predicted as one class, and if the output is negative, the model predicts it as the other class. The linear classifier is the decision boundary (which is the line). Along the line, the outputs are 0. If the intercept changes, the line's orientation also changes (so does the data value points). If the weights or coefficients of the linear function change, the line's slope value and shape change as well. 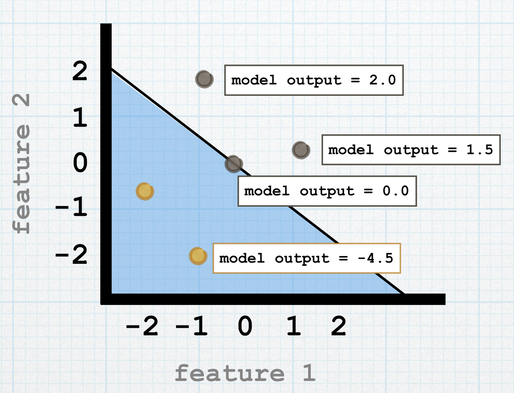 There are lots lots and lots of applications that are correlated with linear classification. And there are also other models which use multi class linear classification, instead of with just 2 classes.
0 Comments
|
Archives
December 2020
Topics
All
|
 RSS Feed
